|
Author
|
Topic: math question
|
rnelson
Member
|
 posted 09-18-2009 08:33 PM
  
As I've explained already, alpha is a scientific term for cutscore, and polygraph examiners use an alpha or cutscore for both DI/SR decisions and NDI/NSR decisions.When making DI/SR calls, alpha represents our agreed-on (in advance) tolerance for error. As required by legal standards like Daubert, we are always interested in a known, established and mathematical method for calculating the probability of a test error. That is what alpha represents - the probabilily of an error. When making a DI/SR call, alpha is the boundary at which we allow a decision. When the probability of error (p-value) is at or less than the specified alpha (cutscore), we have achieved the circumstance in which our calculated probability of an error is within acceptable limits, and we make the DI/SR call. Alpha and p-value represent the probability of a false-positive error. When using a spot scoring rule, we are actually completing several simultaneous significance tests. Every researcher everywhere knows what happens under these circumstances - inflation of alpha. When we set a cutscore or alpha boundary for spot scores, we acknowlege that there is a probability of an FP error for each question. Every question represents another set of circumstances that includes the probability of an FP error. More questions = more errors. Just like driving more miles each year = greater risk for an accident. If we set our tolerance at .05 for individual questions, the inflation of alpha is calculated by simply adding .05 for each question. In a three question ZCT exam the alpha (probility of an FP error) is inflated to .15. In a four question MGQT/investigation exam, alpha is inflated to .2 (1 in 5). Obviously these inflated error rates are unacceptably high and not what we intended. For these reasons, most researchers and scientists frown at the notion of completing several simultaneous significance tests, unless it is necessary to do so. Instead they use Analysis of Variance (ANOVA) based methods. When it is necessary to complete simultaneous tests of significance (such as in a mixed-issue polygraph testing - when we want to know about the examinee's involvement in several distinct behaviors like sex, drugs, rock-and-roll-music, and gambling), we have a problem. Fortunately, a statistician named Bonferonni taught us how to correct for inflation of alpha, and reduce the potential for increased FP errors. This soluation is built into the OSS-3 scoring algorithm for ZCT exams. In screening exams, the goal of testing is often to attain maximum sensitivity to deception, so it is acceptable to not use Bonferonni correction, and tolerate some FPs in favor of greater test sensitivity. On the truthful side of the decision model we have another problem. A computer algorthm can use fancy math like a Kruskal-Wallis ANOVA to help us out, but field examiner who handscore tests are unlikely to take the time to do that. Instead we stick with the well established MGQT/spot scoring rules - -3 in any spot for SR and +3 in every spot for NSR. It is these any or all decision policies that are the subject of the present problem. "Any" is the condition that drives the inflated alpha and increased FPs for SR results. "All" is another matter, pertaining to truthful decision errors, and FN results. Every question has a probability of an FN error. When our requirement is that the examinee pass every question, these probabilities are compounded in an interesting way. First, we have to acknowlege that we don't really know the level of statstical significance associated with +3 for most scoring systems - simply because we haven't been demanding or interesting enough to have studied the normative data at that level. For the purpose of this problem, assume that +3 represtnet a = .05, and that we have set our decision alpha for NSR results at .05. We'll also assume that -3 represents a = .05 for SR decisions. Also assume that we have a multi-issue (sex, drugs, rock-and-roll-music, and gambling) screening test, for which we hand score using spot scoring (any -3 or all +3). Deceptive people have not much trouble failing themselves. And we all know that observing +3 in all spots is an important achievement, and we have all know the tendency for inconclusive results from seen the occasion of finding +3, +3, +3, +2. What we have not realized in the past, is that this is a mathematically driven phenomena - due to a deflation of alpha (closer to zero) that is created by the all condition in the MGQT/spot scoring rules. Deflating the alpha closer to zero reduces the likelihood of a FN error, but increases the likelihood of an INC. Which brings me to my question... Have I calculated the deflated alpha correctly, using this? 
If so, have I calculated the necessary correction correctly using this? 
If not, what, if anything, would be more accurate? Assuming I am correct - I have some interesting news. Here is a table of Monte-Carlo estimates of statistical significance for cutscores in various exam techniques. 
And some estimates of observed and corrected alpha/cutscores for MGQT screening exams. 
And Monte Carlo estimates of accuracy for ZCT exams. 
The above was achieved with a simplified three-position scoring model. More interesting, is a Monte-Carlo estimation of accuracy for mixed issue screening exams - using 2 to 4 RQs with under unknown randomly varied base-rates for each distinct RQ - using the statistically derived and corrected alpha/cutscores. 
If anyone knows the answer to my question, I'm interested. If not, I hope ya'll get a good night's rest. .02
r
------------------
"Gentlemen, you can't fight in here. This is the war room."
--(Stanley Kubrick/Peter Sellers - Dr. Strangelove, 1964)
IP: Logged |
skipwebb
Member
|
posted 09-19-2009 02:03 PM
OK, I guess I'm the only one willing to admit my complete ignorance! I read what you wrote. Reading is my strong suite. I understood very little of it. The only reason I made it through college statistics was the use of a Texas Instruments statistical calculator, never understanding anything other than mean and mode.Based upon your aboce statements and tables, what would be the best cut off score for an examiner to use on the various testing methods to make a call of DI/NDI? IP: Logged |
rnelson
Member
|
posted 09-19-2009 03:55 PM
I thought I made this clear as mud.Skip: quote:
Based upon your above statements and tables, what would be the best cut off score for an examiner to use on the various testing methods to make a call of DI/NDI?
The real question is this: what is the level of statistical significance that is achieved with each cutscore? Cut scores, of course, can be whatever we set them at. The smart thing to do, would be to publish normative data and tables of statistical signficance for our handscoring systems. That way we'd know the level of statistical significance (and the probability of error) for our handscores. Statistical significance, expressed as a p-value or probability value, is the probabiliy of an error. When you call a case DI or SR, p-value is the probability of a false positive (FP) error. When you call a case NDI or NSR, p-value represents the probability of a false-negative (FN) error. Instead of integer cut scores, we use alpha boundaries. Unlike handscore integer totals, which must be greater than or equal to a cutscore, p-values must be lower than or equal to the alpha boundary - meaning there must be a low probability of an error before we are allowed to make a call. What I did was to use Monte Carlo methods (also called Monte Carlo models, or just computer simulation) to study just what you ask - the cutscores and levels of statitsical signficance for different types of exams; ZCT, BiZone/You-Phase, MGQT/investigative, and MGQT/Screening. Of course, cutscores are influenced by scoring scale (3 or 7 position) and by the scoring features. In this case, we assume a 3-position scale, because the 7-position scale depends on some assumptions that are very complex to the point of being possibly unprovable, and are perhaps misguided anyway (i.e., linearity of physiological response magnitude - and the assignment of points according to linear ratios). The 3-position scale is simple and robust in its scientific assumptions - that a larger reaction to a question or type of question, compared with reactions ot other questions or other types of questions, is because the question has greater salience and signal value for the examinee. 3-position scoring makes no unprovable or misguided assumptions about linear physiological response magnitudes. For features, there is about 20+ years of published scientific evidence that the Kircher features are robust and reliable. Any attempt to use other features would demand evidence (not psychologizing, philosophizing, theorizing, or expertizing) that some alternative features work better that the Kircher features. We also doubled all EDA values, because there are a number of studies that demonstrate it is the most robust feature, and drives approximately half of the final score. This simplified scoring system was described in an experiment reported in the Nelson, Krapohl & Handler (2008) Brute Force... paper. It goes without saying that cutscores also interact with our decision policies.
------------------ The Monte Carlo cutscores for ZCT exams, using the simplified 3-position scoring method, are Total >= +2 = NDI, with an observed level of statistical signficance at (p < .1), meaning you are probably right 9 out of 10 times, and you might be wroing 1 out of 10 times. or Total <= -4 = DI, with an observed level of statistical significance at (p < .05). This means that you might anticipate a test error about 5% of the time (1 in 20). If you want NDI decision at (p < .05) you have to use +5). If you want DI and NDI decisions at (p < .01), meaning an estimated less than 1 in 100 chance of error, then use +10 and -9. Our experiments concur with numerous others that the highest rates of decision accuracy can be achieved with the total-score decision rule. However, 2-stage scoring rules offer some advantages: decreased inconclusives and increased sensitivity to deception - while maintaining a good balance of sensitivity to deception and specificity to truthfulness. Therefore, if the total is INC, you can use a spot score of <= -7 = DI. -7 gives you a Bonferonni corrected alpha of .0167, which gives you an observed alpha of .05 in a 3-question ZCT exam. Meaning that you'd still calculate your accuracy and errors as orrect 19 out of 20 times, and possibly wrong 1 out of 20 (5%). -7 will seem counterintuitive to examiner not training in statistics, but it makes perfect sense mathematically and statistically - and it works as predicted by the mathematical model. Here is the table of Monte Carlo estimates of statistical significance for the ZCT. 
We ran a Monte Carlo for the BiZone, which did almost as well as the ZCT, but did not outperform it as expected. We also ran a Monte Carlo for a MGQT/multi-facet/investigative, which cannot mathematically achieve anything close to the accuracy of a 3-question single issue Zone. The problem rests with the spot scoring rules. Here is a table of Monte Carlo estimations of accuracy and 95% confidence intervals for the ZCT, using the above cutscores.
In studying the MGQT/mixed-issue/screening problem we have an interesting observation - the requirement for +3 in all spots serves to mathematically deflate the alpha (closer to zero). This means that if we set alpha per question at .05 for NSR calls, we have an observed alpha of .0127. Meaning that we think or expect to observ errors no more (a = .05), or 5% (1 in 20), but our observed alpha is much lower. This means that someone would essentially have to have a probabily of error (p-value) (p < .0127) in order to pass this test. What this really means is that we'll get an increase in INCs, and we'll be frustrated and want to re-score the test (or find some other way to make the question fit the answer). There is a way to calculate the distortion of alpha, and to correct it. That is what I have done. So, we ran a Monte Carlo experiment, while simulating 10,000 sets of 100 multi-issue screening exams (sex, drugs, rock-and-roll, gambling), while randomly varying the number of RQs from 2 to 4, and randomly varying the base-rate of deception independently for each RQ, from <.01 to >.99. All of this random variation serves to widen the observed variance a little, but gives is a result that can be argued to apply to mulit-issue exams that include 2 to 4 RQs, and have unknown and widely varying base-rates of deception among the distinct RQs.
Here is a table of Monte Carlo estimates of statistical significance for spot scores.
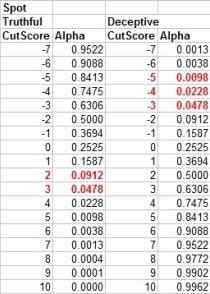
What you'll see (above) is that if you make SR calls at <= -3, you will have an observed level of statistical significance at (p < .05). This means you can estimate you'd be right 19 out of 20 times, and wrong 1 out of 20. You can see that making NSR calls at >= +2 per spot, will give you (p < .1), meaning you can expect to be right 9 out of 10 times and might be wrong 1 out of 10. This is the point of my math question. The requirement for passing every RQ in a screening exam, at a known level of statistical signficance. If I am correct (probably am), with this:
then when we think our alpha is .1 it is actually observed at .026, which is uncessarily low and will increase INC results. If I am correct about this (and I think I am):
Then selecting a cutscore that corresponds to a mathematically corrected alpha will give us the observed alpa we desire when using the all-or-any spot scoring rules. So, +1 in each spot will give (p < .1) for truthful decisions, in Mixed-issue screening exams with 2, 3, or 4 RQs. This means that you'd can expect to be right 9 out of 10 times, and might be wrong 1 out of 10 times. +1 in all spots actually gives (p < .05) for 4 RQs. If you want (p < .05) for screening exams with 2 or 3 RQs then you'd use +2 at each spot. The simple soluation for screening exams is... to use <= -3 in any spot and +1 at all spots. Using these cutscores, we have Monte Carlo estimates of statistical significace at (p < .05) for SR and (p < .1) for NSR. Using these cutscores, I now have the following Monte Carlo estimates of accuracy, and 95% confidence intervals. These confidence intervals are a form of validation excercise that tell us just how good or bad it might be on any given day under any random circumstances.
Of course, this applies only to scores derived using the simplified 3-position model: Kircher features only, double the EDA, using the basic bigger-is-better principle. Statistical significance for 7-position scoring systems, using 12 or more features, are unknown. It should become our expectation that all people involved in the development and validation of scoring systems should be required to publish normative data, estimates of statistical significance, and confidence intervals or other validation data describing expected accuracy. .02 r
------------------
"Gentlemen, you can't fight in here. This is the war room."
--(Stanley Kubrick/Peter Sellers - Dr. Strangelove, 1964)
[This message has been edited by rnelson (edited 09-19-2009).] IP: Logged |
Ted Todd
Member
|
posted 09-19-2009 05:04 PM
ZZZZZZZZZZZZZZZZZZZZZZZZZZZZZZZZ !
???????????????????????????????? !Ted IP: Logged |
rnelson
Member
|
posted 09-20-2009 01:09 AM
Glad you enjoyed it Ted.For an interesting and historical look at a supporting reference to Monte Carlo models. From the good people at RAND.
http://www.amazon.com/Million-Random-Digits-Normal-Deviates/dp/0833030477/ref=cm_cr_pr_product_top The reviews are actually kind of funny. ------------------
"Gentlemen, you can't fight in here. This is the war room."
--(Stanley Kubrick/Peter Sellers - Dr. Strangelove, 1964)
IP: Logged |
stat
Member
|
posted 09-20-2009 07:23 AM
Ray,Maybe some parables are in order? I like stories about kitty cats. IP: Logged |
rnelson
Member
|
posted 09-20-2009 08:53 AM
OK,Let s'pose we were hiring someone to gaurd the animal shelter, and had to do a background check. What we want is to hire a good guy, an animal lover, and not someone with a potential for becoming compromised in his duty to keep the critters safe. Now let's s'pose we get to do a screening polygraph as part of the hiring process, and that some ivory tower researcher happens to have done a Ph.D. (which means piled higher and deeper) on the correlates and predictors of feline foul-treatment. This is nice, because we know the smart questions to aks about on our screening polygraph. So, s'pose, for the moment, that, like other risk prediction schemes, animal antimpathy was best predicted by past behavior, especially any history of questionable or abusve treatment of the string-loving fuzzy creatures. We decide to use a 4-question MGQT as a screening test, and our targets are: 1) Did you ever swing a kitty-cat by its tail? 2) Did you ever fire a projectile at a feline anmimal? 3) Did you ever scold a cat for scratching is claws on something scratch-worthy? and 4) Did you ever try to make a LOLCAT photograph? (which any cat would argue as a severe form of shame and abuse) Remember: dogs have masters, cats have staff. Assume we have adequate operational definitions for all these behaviors. Also assume that a person who passess these questions can be regarded as safe and truthworthy to guard the cathouse, and that a person who doesn't pass any of them must be regarded as presenting an increased and unacceptable threat to the four-legged coterie. Our adminstrators have told us they wan't a good accurate, but not OCD, test, and have asked that we set our tolerance for error at .05. This means that they want to be about 95% sure they are hiring a safe and reliable hombre to watch the felines. So we run the test. For convenience, let's imagine that one of our applicants passes the test: that is looks as if he never swung a cat by the tail, never shot any kind of projectile at a cat (i.e., rubber-band, BB, spit-wad, arrow, rock, dirt-clod, book, magazine, or bullet), never once attempted any form of reproach against a cat for simply exercizine its natural instinct to stratch its claws on some immenently scatchable piece of furniture, and 4) never caved in to the temptation to make some kind of LOLCAT picture to email one's friends and family (or worse: upload to the Internet). Also for convenience, assume our applicant passed each question with a p-value exactly at .05. What I'm saying is that passing every question at p = .05 actually gives a probability of .0127 that the person was involved in any of those acts of animal cruelty. I'm also saying that when we think we have set alpha (cutscore or tolerance for error) at .05 (1 in 20), we will observe alpha closer to .01 (closer to 1 in 100). What this means is that we are using an unrealistic cutscore. The result will be high rates of inconclusive results, unless we do something to fix it. Adjusting the cutscores has been discussed. However, people have been uncomfortable with this - probably because know intuitively that we don't know much about the level of statistical significance of our existing cutscores. Therefore, changing them ammounts to being lost in the woods and deciding to simply wander around for a while instead of staying in one place and wait to be found. What I have done is to triangulate the present location (OK, not a cat metaphor). Adjusting the cutscores is the correct solution, as long as we know the level of significance that we select. What I've done is calculate the level of significance for cutscores for screening tests under varying circumstances: including 2, 3, or 4 RQs, and randomly varying base-rates of involvement/deception. I suspect that current field practices more often emphasize the resolultion of inconclusive results by re-scoring the data, by looking for additional points in they pneumos, or changing the scoring scale. All of this, while we examiners may be comfortable with it out of habit, is highly unscientific. It will be viewed by scientific minded critics as a form of changing the question to fit the answer. What I'm saying is that if you want to investigate someone's involvement in various risk-predictive behaviors related to cruelty to kitty-cats or other bad things, and if we want to be confident in our results at the .05 or .1 level (meaning we'd expect to be correct 19 out of 20 times), then using +3 in every spot is not the optimal solution. What I've done is to calculate the correct solution - unless someone can point out what is wrong with my math or my method. Of course, there would be an expectation to provide a more correct soluation and more correct calculation of the level of statistical significance achieved by each cutscores. Hope this helps. Now back to the road. r
------------------
"Gentlemen, you can't fight in here. This is the war room."
--(Stanley Kubrick/Peter Sellers - Dr. Strangelove, 1964)
IP: Logged |
blalock
Member
|
posted 09-20-2009 06:31 PM
FYI,
In addition to the traditional TDA scoring systems (Federal, Utah, Objective Scoring System, ASTM, etc) our basic polygraph school students will be taught the Simplified Scoring System (SSS). The cutscores proposed in these postings are supported by the math, unlike some cutscores that we are traditionally used to. Now, the consumers of our work product can select the level of confidence that they are comfortable with, and we can use cut-off scores accordingly. Just to clarify, Raymond, IF well-trained, ethical field examiners 1) are using validated CQT polygraph techniques, 2) are using the SSS to handscore their test data, and 3) our consumers (decision-makers) want to expect that our testing should be right 9 out of 10 times for non-deceptive results, and right 19 out of 20 times for deceptive results, THEN we should use the following cut scores:Single-Isse diagnostic examination (3 RQ) NDI >= +2 overall
DI <= -4 overall Multiple-Issue screenng examination (2-4 RQ) NSR >= +1 in each spot
SR <= -3 in any spot
------------------
Ben blalockben@hotmail.com
[This message has been edited by blalock (edited 09-20-2009).] IP: Logged |
rnelson
Member
|
posted 09-20-2009 07:34 PM
Nearly perfect.The numbers are correct now. However, there is a subtle, but important, issue in interpretation. With SR/DI at .05 the chances are 19 out of 20 the guy aint truthful. That is not exactly the same as we are right 19 out of 20 times. Same with NSR/NDI at .1 - the chances are 9 out of 10 he's not deceptive. But that's not exactly the same as saying we are right 9 out of 10 times. Bear with me on the OCD problem here - it's important. It's the difference between 1) we are correct X out of Y times, and 2) chances are X out of Y that he's not H0 (null hypothesis). It's the difference between Bayesian and frequentist statistical approaches. Your statement is Bayesian, which is non-resistant to base-rate. Meaning your rate of decision errors will be influenced by the a-priori or external probability. The frequentist statement, as I have said it, is correct regardless of the prior. Having interpreted a test result this way, there is still the influence of base-rates on observed error rates. But it would be a mistake to attempt to use Bayesian methods to evaluate test efficiency. First we interpret the likelihood that a result was produced in error, then we interpret the likelihood we are wrong when we put the guy into the category of deceptive/truthful. The likelihood we are wrong is influenced by the base-rate of deception, and by the INC rates for truthful and deceptive persons. It would be better to stick to the frequentist interpretation - the probability the result was produced by a person from the other group. Use Bayesian models when you want to do so -not by accident. .02 r [This message has been edited by rnelson (edited 09-21-2009).] IP: Logged |
Poly761
Member
|
posted 09-21-2009 10:51 AM
Suggest you send this off to MIT/Mathmatics Department and see what they have to say.END..... IP: Logged |
rnelson
Member
|
posted 09-21-2009 12:14 PM
We do want to be able to show this to non-polygraph scientists. In the same way that having cogent theories based on nown and proven constructs will buy us more crediblity with scientific critics than some unproven expertizing or psychologizing - having a decision model based in the language of statstical inference helps us meet challenges like the Daubert requirement for known methods for calculating the likelihood of an error. When we do show this, we'd like not to get spanked. We'd like to prevail in any ensuing argument. So we ought to try to understand it first. We could wait for the scientific community to become more openminded abou the polygraph, at which point they're own curiosity will lead them to solve these problems for us. But that might be a long wait - a lot of scietists have been turned off to polygraph by what seems like bad press at the NAS, and they may tend to have concerns about pseudoscience when they observe folks who lack knowledge about math and science who try to market a scientific test. It's better to show this here first, and be sure our argument makes sense to people who understand polygraph phenomena in the trenches where it happens. .02 R
------------------
"Gentlemen, you can't fight in here. This is the war room."
--(Stanley Kubrick/Peter Sellers - Dr. Strangelove, 1964)
IP: Logged |
Poly761
Member
|
posted 09-22-2009 12:16 AM
You're presuming the MIT people or others with advanced skills in mathematics would not look favorably on us. Reaching out for their assistance in resolving a problem such as this, and others, could help open the minds of the scientific community regarding our profession. It is because we lack advanced knowledge of math/stastics that we ask for their help in establishing what you refer to as a "decision policy." What's to lose?IP: Logged |
Barry C
Member
|
posted 09-22-2009 07:48 AM
For the record, I once reached out to our local university. They have a Master's program in statistics. They didn't know how to solve Ray's problem (whatever it was back then), and because it was polygraph, there was little interest to figure it out. After Ray figured out the issue, I sent it back to those folks who simply said, "Yup, that worked."It seems Ray is right: we need to know what we're doing so we can explain it to others. Those in polygraph who are proficient in statistics have told we'll never satisfy purists with the statistical methods we use in the social sciences, so we really need to be able to justify what we do with those in our circle of influence, and we need to expand that circle carefully and thoughtfully. IP: Logged |
skipwebb
Member
|
posted 09-22-2009 09:59 AM
OK, I'll bite....If we can prove, mathematically, that the optimum cut off scores are "X" for DI and "Y" for NDI on a specific issue, single issue or multi-facet test and the EDA should be given double value, why do 16 polygraph schools and the federal government schools (US, Canada, Mexico, Israel) still continue to teach the wrong cut off scores?I would think that DACA has some smart PhD type people that understand math and statistics well enough to go to the school directors and say we should change our ways. I'm sure that every school's goal is to teach the best approach to getting the right answers. IP: Logged |
rnelson
Member
|
posted 09-22-2009 10:35 PM
Answer: because that's the way it's always been done.----------- The real answer is that existing cutscores have been in use for a long time. Polygraph examiners, as a culture, have a strong appreciation for compliance with rules and authority, and the inherent wisdom in not trapesing off in the unknown wilderness without a map and a plan. Fewer casualties that way. So, the best thing to do is sometimes/often not to change anything until we are sure about what will be the result. The only times when it is wise to do something/anything without a properly formulated plan are when not doing something is sure to be disastrous. In our case, proceeding without a good plan, backed by good math an science, will mean we allow ourselves to 1) play a silly game of follow-the-leader with someone who wants to be the grand poo-bah, or 2) act like imprinted gooslings following a maternal imposter. We'll then find ourselves left behind the rest of the sciences. Or we could do nothing, and we'll still be left behind. Or, we can make a good plan, supported by good math and good science, and proceed slowing and methodically to show that the polygraph is just science. 3 position scoring has been discussed, and cussed at, and there has even been some rhetoric devoted to idea that the optimal cutscores for three position scoring might be different than those for 7 position scoring. It has been my impression that most people have not changed there cutscores even when using the 3 position scale. Why? Probably because they are intuitively aware that we have not really known what, exactly, the optimal cutscores should be - and probably out of fear of criticism. So, we use the same 'ole 7-position cutscores with the 3-position score and grumble about inconclusives. Then we pacify ourselves with some assurance that we can always re-score it using 7-positions if it is INC. The problem is that this is the scientific equivalent of shooting an arrow at the side of a barn (to see if we can hit it), then drawing a bullseye around the arrow so we can brag about our accuracy. We are simply habituated to the practice out of habit, so it doesn't bother us - we are comfortable with it, in the same way that people who drive too fast are comfortable speeding and frustrated when having to do the posted legal limit. We will be a lot less comfortable with the re-scoring method of resolving INCs when we have better knowledge of the inferential statistics and decision theoretic problems associated with our cumulative Gaussian-Gaussian handscored CQT polygraph. It does not make sense to use the same cutscores for 3-position and 7-position scoring, when we know intuitively that 3 and 7 position scales can give total scores of different magnitude. In statistics we'd say say "they have different distributions of scores." That is, they have different location (average scores for truthful and deceptive), and potentially different shape (variance - how the data vary or spread out around the truthful and deceptive average). Backster knew this and attempted to give us different cutscores for 2, 3, and 4 charts. Kircher's data reveals that after a certain number of charts it may not make much difference - differences are lost with in the normal variance of the data. I believe that is why the Utah people don't change the cutscores from 3 to 5 charts. But the fact remains that our researchers have not adequately studies or published the normative data or level of statistical significance for 7 position or 3 position scoring. There is also the fact that these norms will differ depending on the features employed (12 features or 23 features), and on other scoring rules. To be fair, Krapohl (1998) described the mean scores for 3 and 7 position scores, but did not provide the variance. Without the variance the averages are pretty much useless. Blackwell (1999) compared 3 and 7 position scores, but did not obtain 3 position scores using the Bigger-is-Better rule. Instead 7 position (ratio-based) scores were converted to their 3-position equivalents. Therefore, those 3 position scores may not be representative of 3-position scores in field practice Blackwell also made no effort to account for differences in distributions or cutscores when comparing 7 and 3 position scales. Regardless, the scores described by Krapohl (1998) and Blackwell (1999) were derived using the 23-feature pattern recognition approach and cannot be regarded as representative of scores derived from the current (DACA, 2006) 12 feature scoring system. Krapohl, Dutton, & Ryan (2001) did provide mean and variance data (norms) for truthful and deceptive cases, when they compared 7 position and 3 position scales. Again, these scores were derived using the old 23-feature pattern recognition system, and cannot be assumed to be representative of the currently used empirically valid 12-feature system. Buried somewhere in Matte's (1996) book is a description of the mean and variance of his scores – I think most people didn't notice. Matte's scoring system is an extension of Backster's, and not representative of the current Federal 12-feature system, Utah, or ASTM (all of which are similar except for ratios and decision policies). Honts and Driscoll (1987; 1988) provided mean scores for truthful and deceptive cases in a rank order scoring paradigm. They did not provide the variance, but reported the difference as statistically significant. Honts and Driscoll used Kircher features, which are only partially representative of the current 12-features scoring protocols. More importantly, it is likely that Honts and Driscoll are aware that rank-order scoring will result in a non-normal uniform distribution of scores, making the variance meaningless. Gordon & Cochette (1987) and Gordon (1999) also described a rank order scoring model, using a unique set of physiological measurement features for which no validation data can be found in the published literature, and for which mean and variance data are missing from the published reports. Again, rank-order systems can be expected to produce data with uniform (non-normal), and the resulting distributions of total scores are without any published description or empirical data. Krapohl & McManus (1999) and Krapoh (2002) did provide normative referenced lookup tables for the level of statistical significance of OSS-1 and OSS-2 scores. The OSS, while effective, produces scores that are not representative of the current hand scoring practices based on Utah, Federal/2006, or ASTM features. OSS, due to its time intensive, though highly structured model, is no longer a handscoring system. It has become a defacto computer scoring algorithm that has been subject to substantial revision (Nelson, Krapohl, & Handler, 2008). The fact remains that we simply don't know the level of significance for most of our currently used scoring systems - because we don't have published normative data (with confidence intervals). And we are so used to this condition that we barely know how to appreciate the magnitude of this deficit in our science, and barely know how to even talk about it – in terms of variance, norms, and statistical significance. This is unfortunate, because Barland (1985) told us what we could do with mean and variance data. Barland's suggestion seems to have been un-noticed until 1999, when it was incorporated into the OSS. Why, you ask, does all of this matter to a field polygraph examiner? Tell a scientific minded critic (opposing counsel) that a person scored +6 or -6 on a polygraph, and they will ask "six what?" To us it's obvious that we mean six points, but if we said that we'd get another curious question: "what's a point?" Annoying as it seems, this is a good question. In computer scoring "points" are standard deviations, and the fact that we have standard deviations communicates volumes of information: 1) that we have standardized/normed data, and 2) that we know the location and shape, or mean and variance, of the data. Mean, or average, refers to how the data of from different deceptive individuals tend to be similar, and how the data from different truthful individuals tends to be similar. Variance refers to how the data within those deceptive and truthful groups also tend to differ, within the groups. Data are always both similar and different, and it is an expectation of any field of science to have a mathematical way of describing these. Anyways, scientists already understand this, so we're more likely to tell our inquisitor something simple like "we assign points when there is a difference in the degree of reaction to the RQ or CQ - assuming he already knows from AP about the secret polygraph CQT handshake (he could also get that from NAS). All this prompts another begging question: "how do you decide whether to award 1, 2 or 3 points?" At which point we 'splain about our ratios (or descriptive adjectives: bigger, obviously bigger, dramatically bigger), prompting yet another scientific question: "what is the relationship between those linear ratios described by the 7-position points and the actual magnitude of physiological response (not the picture we see on the polygraph screen, the actual physiological response values). Answer: we don't know. We do know that physiological responses are often not linear. So, it makes no sense, in terms of science to represent non-linear phenomena with a linear scale - unless we take the time to do so with an assumed non-parametric model (in which case ratios don't matter anyway), or take the time to represent non-linear phenomena with a known linear transformation of the non-linear phenomena. This would require we take the time to study the non-linear phenomena, plot its location and the shape of its distribution (sometimes log-linear in physiology) etc. If you feel lost by now, you will be realizing just how far we have to go to "validate" the assumptions that define the 7-position scoring system. The 3-position system will ultimately be simpler and more defensible science. When the scientific minded critic or skeptic asks: “six what,” our answer is “six points.” When the question is: “what's a point.. what does a point represent,” the answer is: “we assign points when the response magnitude is larger to either the CQ or RQ.” When asked: “what is the linear relationship between those points and the actual magnitude of physiological response,” the answer is “it doesn't matter, no linearity is assumed, in fact, it is assumed that actual physiological responses might be non-linear. (At this point, it doesn't even matter if the EDA system is linear – only that it is approximately linear.) What is assumed is only that a larger response to a question or type of question indicates only that the question or type of question hold greater salience for the examine, compared to the other questions, due to emotionality, cognition, or behavioral experience.” No further questions. Having said all that, there is a remaining question... Why should we use our existing cutscores? Why has it been a good idea to use +/-6 and +/-3? Answer: Tradition. Because that's what we've always done. Better answer: Because most of the research used these cutscores – even if that research was reported in simple frequencies and proportions with little effort to describe the normative distributions. Because we know how they perform in validity studies of outcome frequencies. But then we're frustrated with the INCs of 3 position scoring or frustrated with the fiction of 7 position scoring. Question: Why should we change? Answer: Because we now know the optimal scores for different types of exam formulations. We can know the level of significance, error rates, and expected INC rates of optimal decision cutscores. We know more about this now than we did last year because we've taken the time to build a Monte-Carlo simulation to study a problem for which we will likely never be able to study live (mixed issue screening exams). We've been thinking and working, on and off, on this since the fall of 2007, after the APA conference at which we first showed OSS-3. It was only recently that we finally understood the alpha problem on the truthful side of mixed issue exams. While it took some time to figure out, it actually seems kinda simple now that it's been described. Things like Monte-Carlo simulations are ongoing projects that should continue to become more sophisticated and informative as we continue to learn more and gain more data. More good news: If we had data from current scoring systems, we could adapt the Monte Carlo models to produce and publish normative data, tables of statistical significance, and optimal cutscores for any of our existing scoring systems. We could even quote:
I would think that DACA has some smart PhD type people that understand math and statistics well enough to go to the school directors and say we should change our ways.
Well, we do view DACA as the top of the intellectual food-chain. The problem is that DACA's relationship with the private APA school directors is probably best described as “influence without direct authority.” Because they are the big dog, when they change everyone else will too. How many people clung to the complex scoring system until 2006, and then acted like “oh we've been doing that for a long time” in response to the 12 feature system. Mostly what people seem to try to say is “we do whatever DACA does...” Here's the joke: I would estimate that 90% or more of the scores from the current Federal/12 features system are driven by Kircher features. 6 of the 12 features are pneumo features. Of the six non-pneumo features there are 4 secondary features and 2 primary (EDA amplitude, and Cardio-amplitude of increase in the tracing average at diastole). Secondary features are used only when primary features are equivalent – which means they are mostly not used. Of the six pneumo features (not RLL), they really amount to three features: I/E ratio change is really just slowing, and apnea is just severe slowing (stopping) if you trust it to score it. So, we have: 1) suppression, 2) slowing, and 3) temp baseline increase. Simple. So, the simple answer to your question is that we've been doing and teaching the same old things because we didn't have a better answer, because we couldn't study the problem because it seems intangible. Now we can study it, the same way we study other intangible problems (Monte Carlo simulation) and we can learn the optimal answer. As you point out, the real challenge will be to get the school directors on board. The difficulties there have to do with 1) safety, 2) and 3) ego. First, it may be tempting to feel safe when doing nothing or the same old thing – and to attempt to assume no responsibility for one's choices with some version of “that's the way its always done,” or “that's what they do at ...” Second, it may be tempting to ignore the challenge and invitation to study and publish normative data, out of fear of not understanding or fear of not performing. Finally, it may be tempting to assume that our expert opinions alone are a sufficient substitute for normative data, or that we already know everything we need to know, or that professionals in the field of scientific lie detection need not know for themselves about science. Look back a bit and you'll see some of the smartest people in lots of fields have said and done some silly things. It is my understanding that Backster didn't initially envision numerical scoring for field use – it was for training. Today, it is well understood that all tests need numerical models. It is my impression that Reid, while he seems to have invented the comparison question test, may not have appreciated the value of numerical scoring – which is made possible by the CQ. Look in other fields: Freud thought he alone would tell us everything we need to know about psychology; Einstein was critical of quantum theory in his debates with Bohr and Planck, and let's not forget that George Washington's doctors basically killed him with their best thought-out solutions to his health problems. We all need to be intelligent and informed consumers of science. Mostly that means an expectation for accountability, documentation, and transparency – else we'd be just like voice stress – all fluff and no stuff. .02 r
------------------
"Gentlemen, you can't fight in here. This is the war room."
--(Stanley Kubrick/Peter Sellers - Dr. Strangelove, 1964)
IP: Logged |
Bob
Member
|
posted 09-22-2009 11:12 PM
Ray;I've been trying to send you short email- with a question (about nothing on this topic) but it keeps getting returned as undeliverable; did you leave the State of Rocky Mountain High? Bob IP: Logged |
rnelson
Member
|
posted 09-23-2009 06:36 AM
There is a dead email address on my webpage.try raymond.nelson@gmail.com I now have a new email at rnelson@lafayetteinstrument.com I'm in your state right now Bob - have to go back to Denver next week, and then some more running around to different places. r ------------------
"Gentlemen, you can't fight in here. This is the war room."
--(Stanley Kubrick/Peter Sellers - Dr. Strangelove, 1964)
[This message has been edited by rnelson (edited 09-23-2009).] IP: Logged | |


 Polygraph Place Bulletin Board


